Replaying data#
AirTrafficSim allows you to replay historical and simulated flight data. For historical flights, the data are stored in airtrafficsim_data/flight_data, while the data for simulated data are stored in airtrafficsim_data/result/. For the details of the replay function, please refer to the API reference airtrafficsim.server.replay.
Replaying historical data#
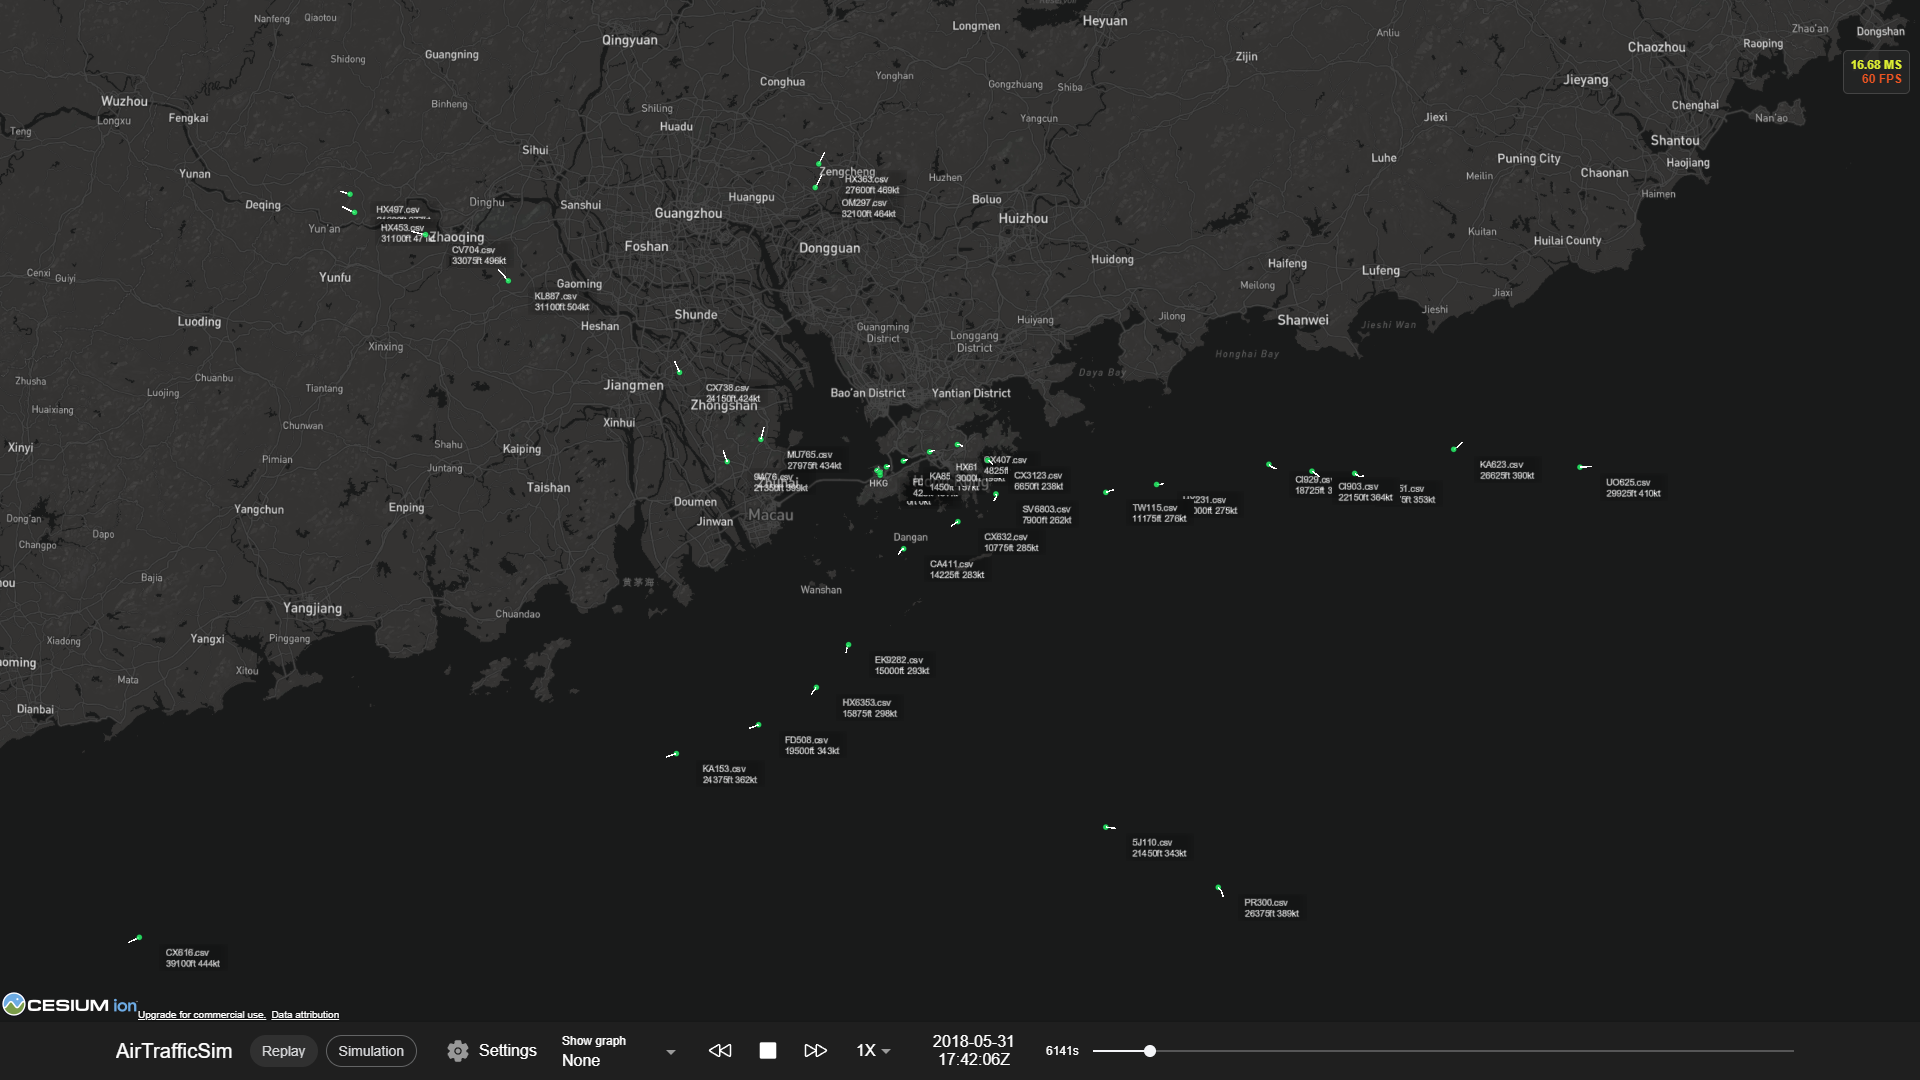
Historical data from with FlightRadar24 and OpenSky format can be processed. A sample data with FlightRadar24 format is provided in airtrafficsim_data/flight_data/2018-05-01/. Note that each CSV file in the folder represents one flight with the parameters specified in this guide.
To visualise the historical data, you can select the Replay button in the toolbar and select 2018-05-01 in the popup menu under the HISTORICAL tab. This will inform AirTrafficSim to process the flight data in the folder airtrafficsim_data/flight_data/2018-05-01/. This is what the sample data looks like in the UI:
Note
Sometimes, there might be a problem to replay OpenSky data if the data size is too large, as the data frequency is quite high. Work is in progress to improve the handling of OpenSky data by integrating the traffic library.
Replaying simulation data#
The output of a simulation will be stored in a new folder in airtrafficsim_data/result/ with the following format <environment name>-<actual simulation start time in UTC>. In each folder, there will be a master CSV file containing all flights in simulation with the same name.
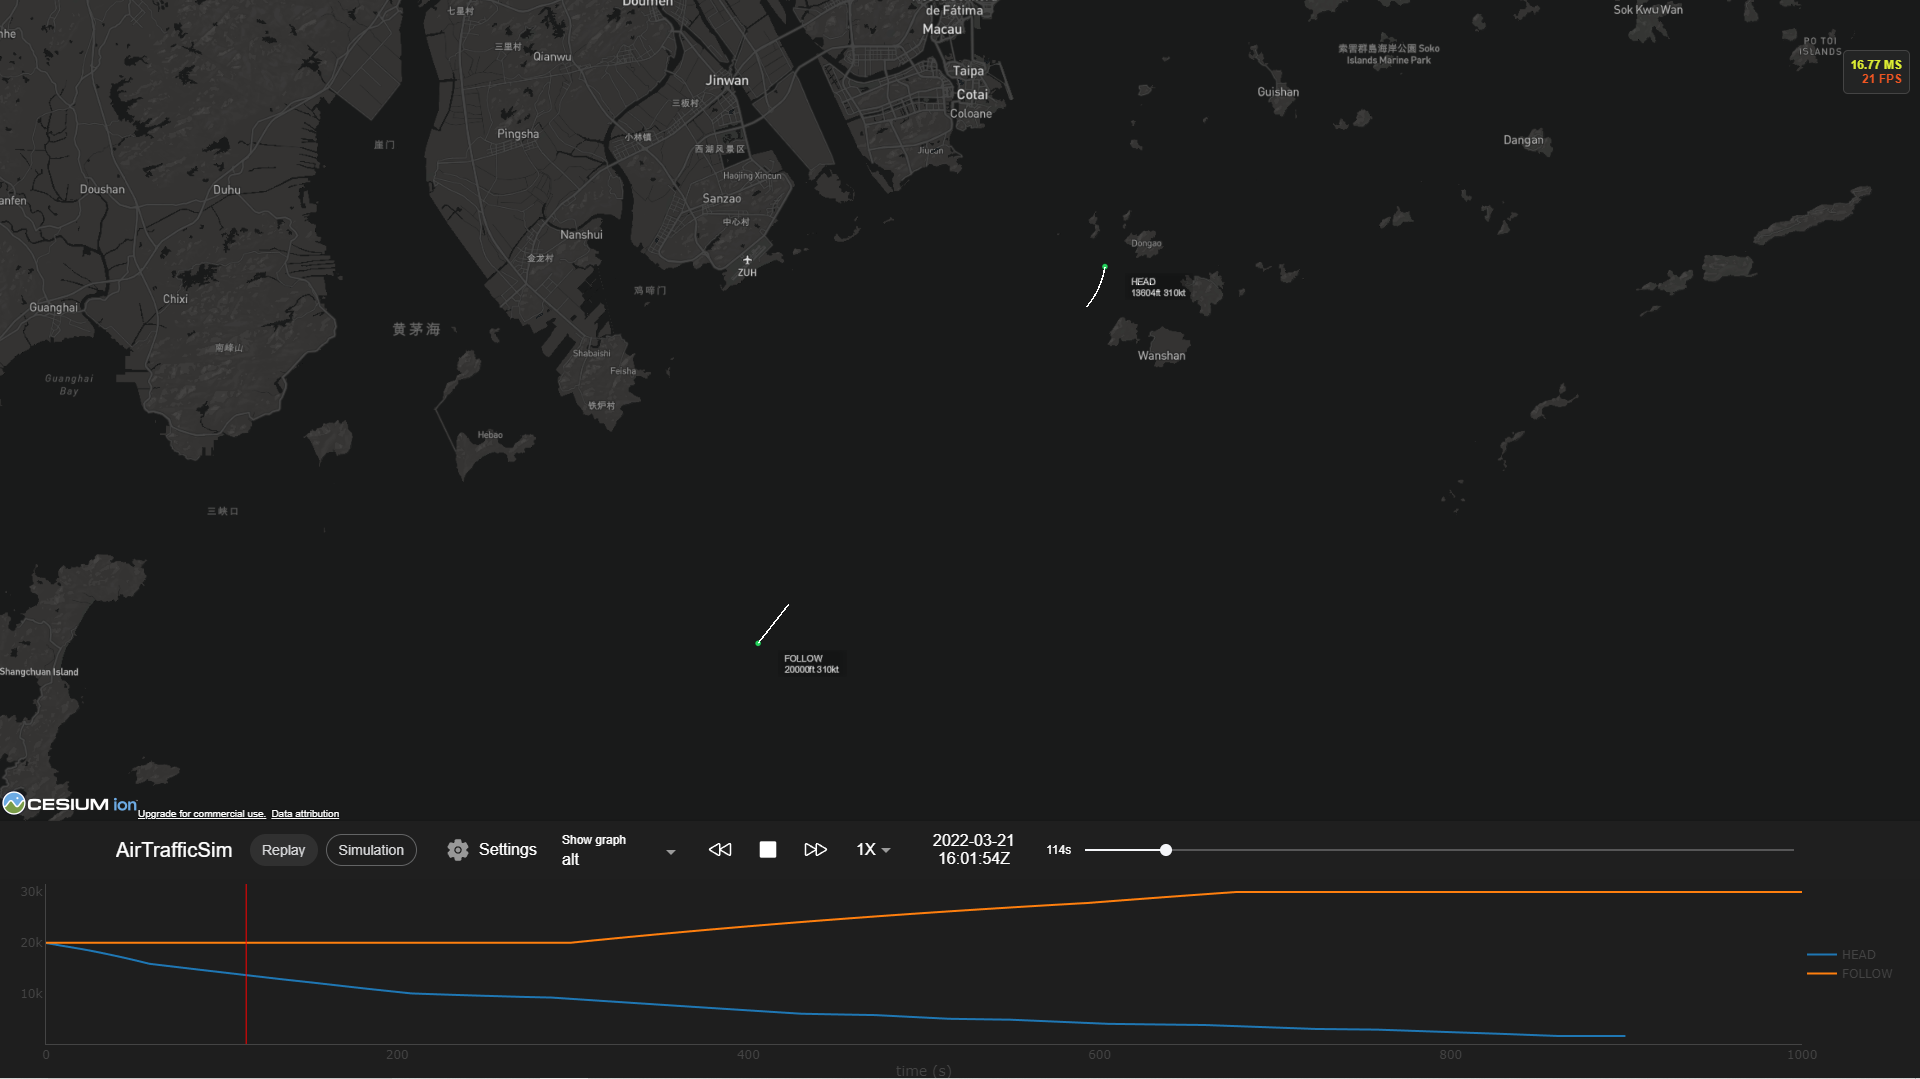
To replay simulation data, you can create one sample data by running python -m airtrafficsim --headless DemoEnv. You may find the sample data located similarly at airtrafficsim_data/result/DemoEnv-2022-09-06T03:48:21/. Then, you can select the Replay button in the toolbar and select DemoEnv-2022-09-06T03:48:21 in the popup menu under the SIMULATION tab. This will inform AirTrafficSim to process the simulation data in the folder airtrafficsim_data/result/DemoEnv-2022-09-06T03:48:21//. This is what the sample looks like in the UI:
Tip
When replaying simulation data, you can view the plot for different simulation parameters by using the “Show Graph” selector.