Navigating the UI#
The web-based user interface contains two main parts: the globe viewport at the top and the toolbar at the bottom. This page will explain the usage of the different components in the UI.
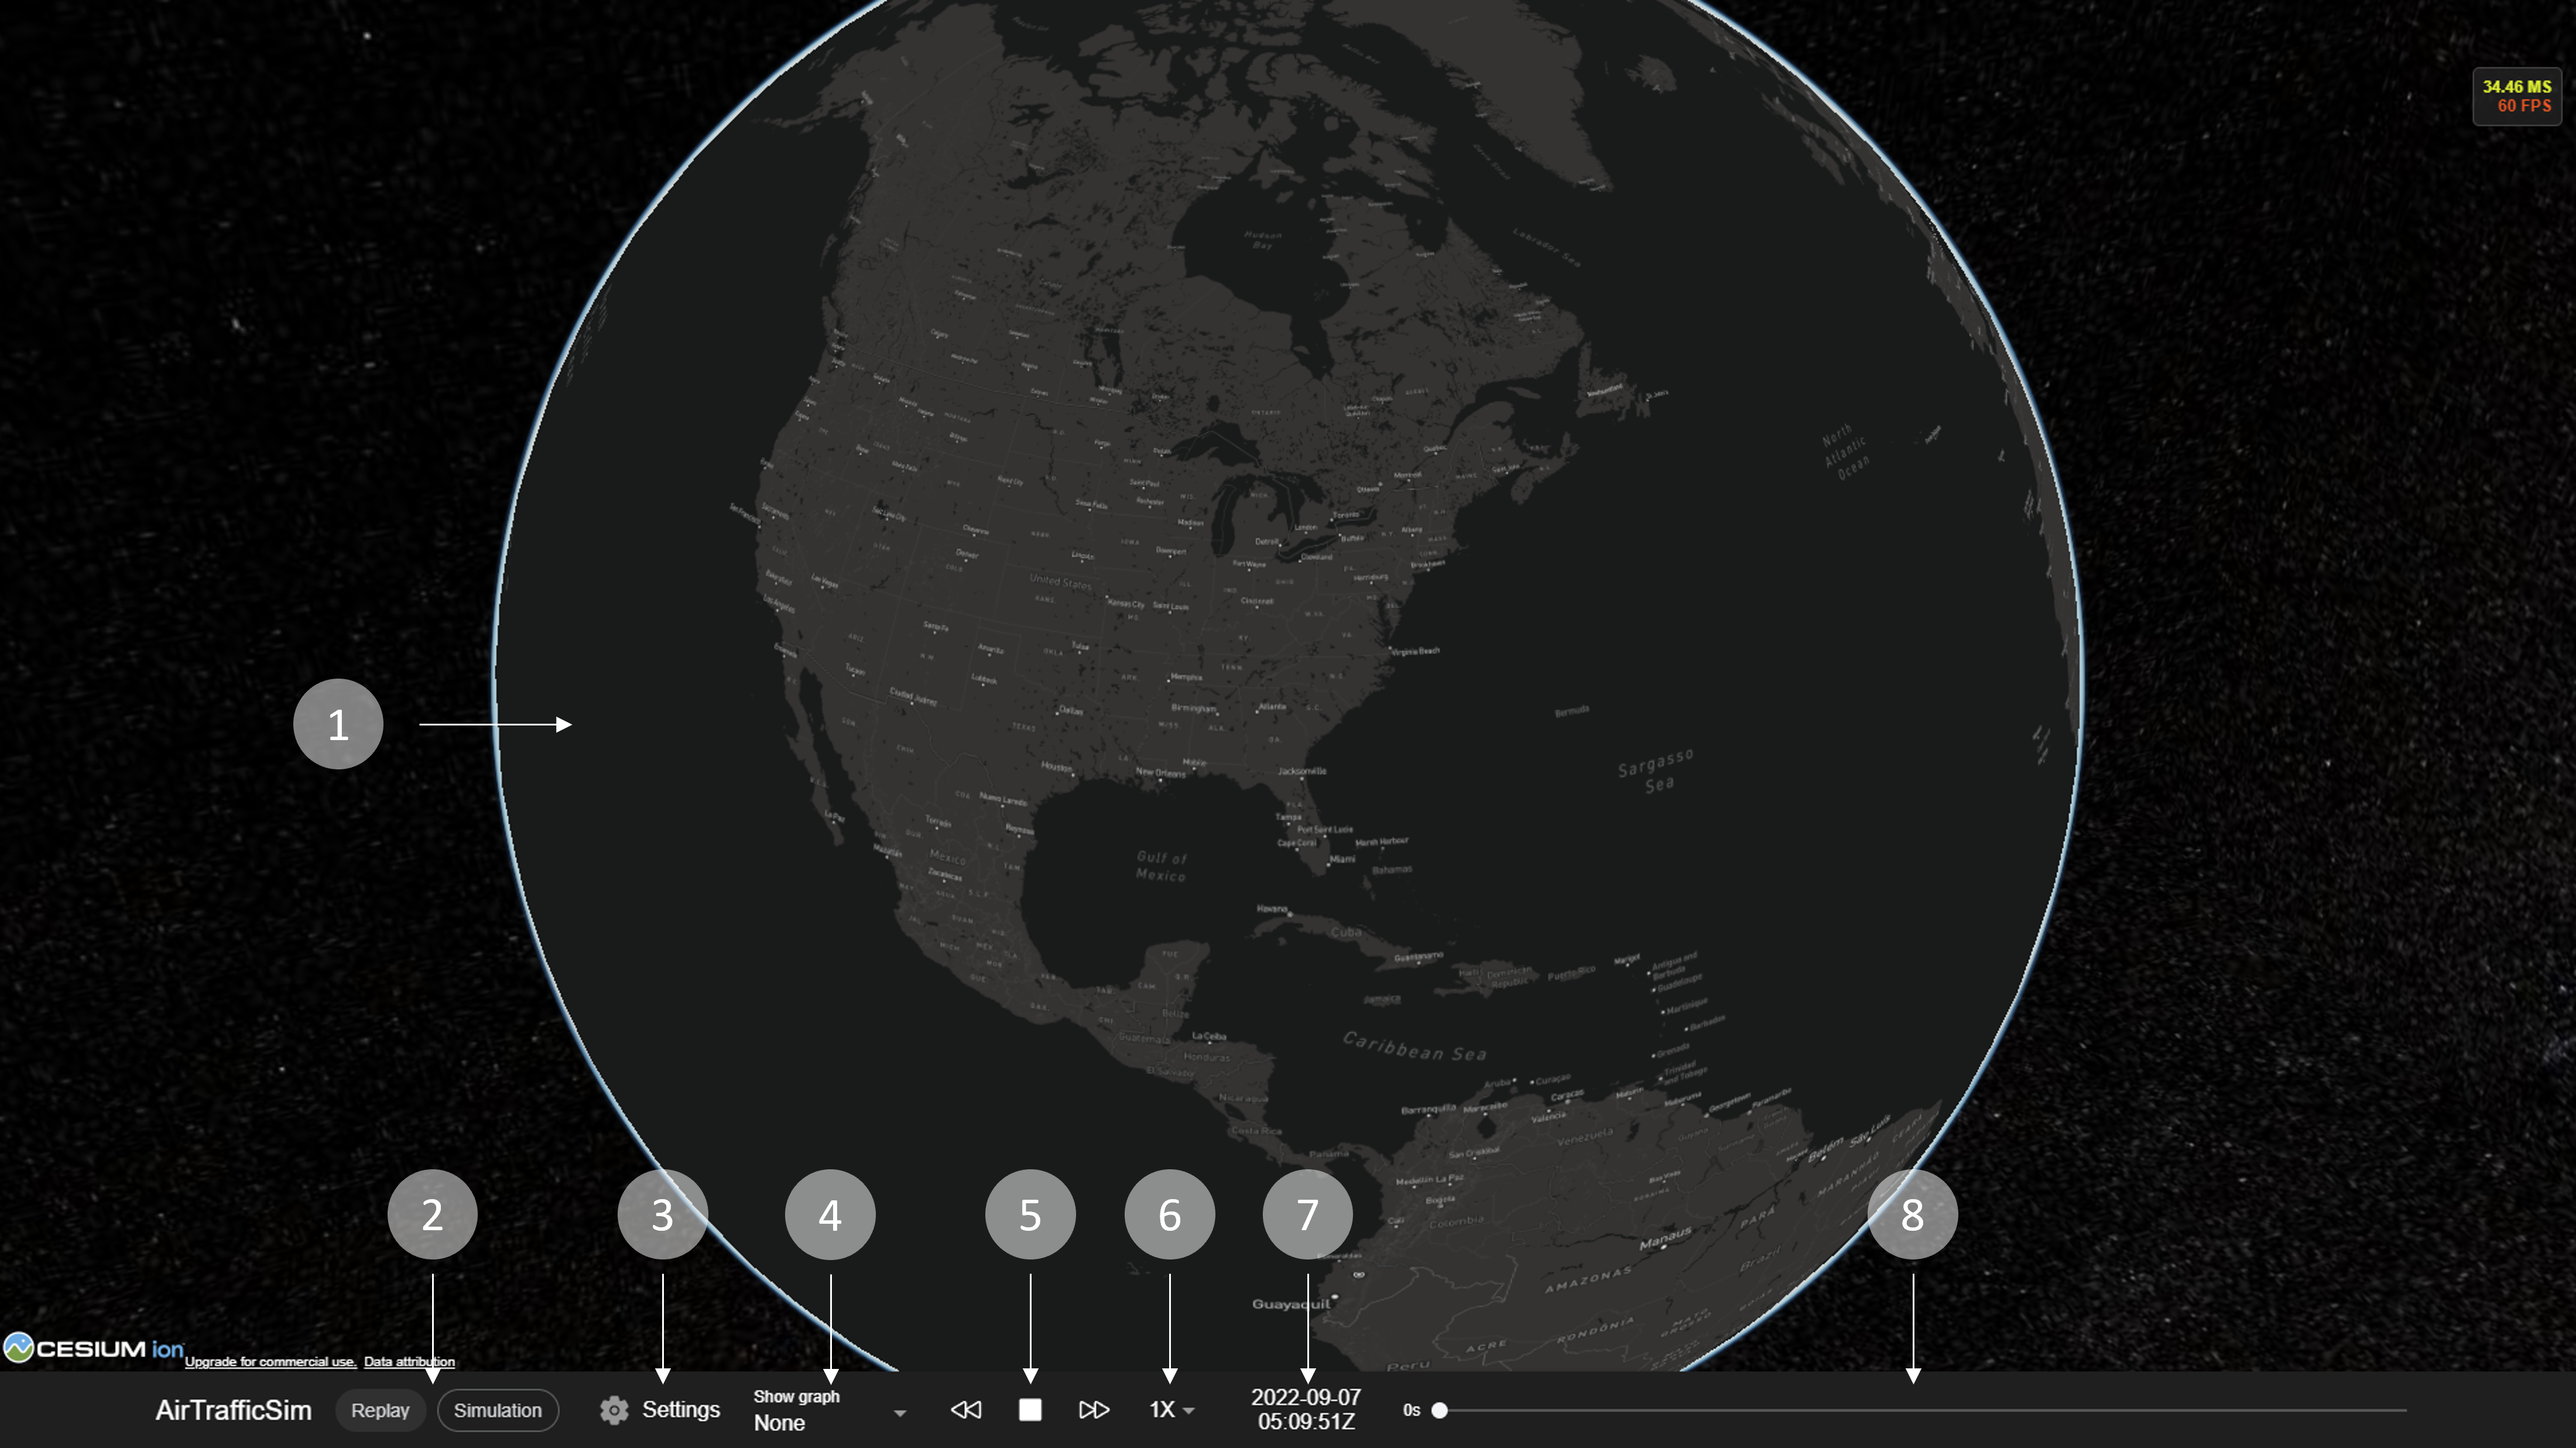
1. Globe viewport#
The globe viewport provides a 3D globe for a user to interact with. You can operate the camera with a mouse or with touch gestures following these methods.
Mouse |
Touch |
|
|---|---|---|
Pan |
Left click + drag |
One finger drag |
Zoom |
Mouse scroll wheel or Right click + drag |
Two finger pinch |
Rotate |
Middle click + drag, or CTRL + Left/Right click + drag |
Two finger drag |
2. Mode selector#
You can select different AirTrafficSim modes (Replay/Simulation) by clicking on one of the buttons. Replay mode will replay historical or simulated flight trajectory data stored in airtrafficsim_data/flight_data while Simulation mode will initiate a simulation by selecting an environment file from airtrafficsim_data/environment and visualise the flight trajectory live.
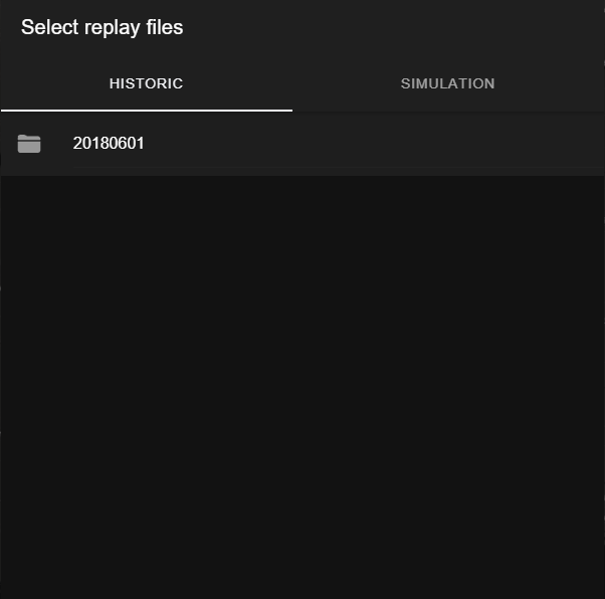
In Replay mode, select the reply data file which can be historical or simulation data.#
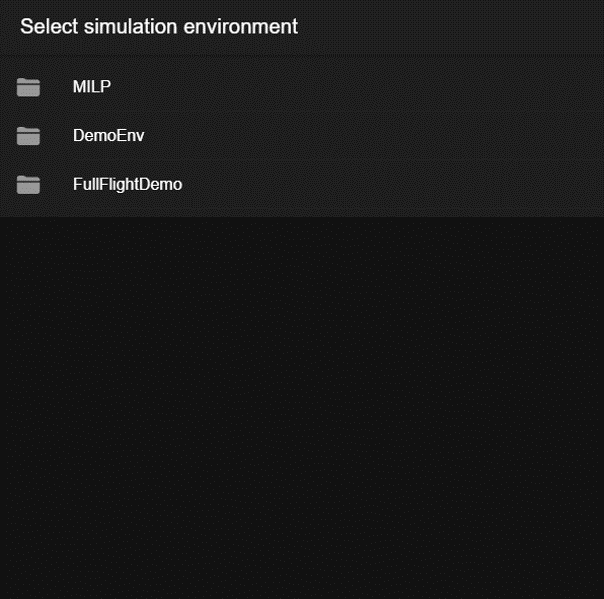
In Simulation mode, select a simulation environment to begin the simulation.#
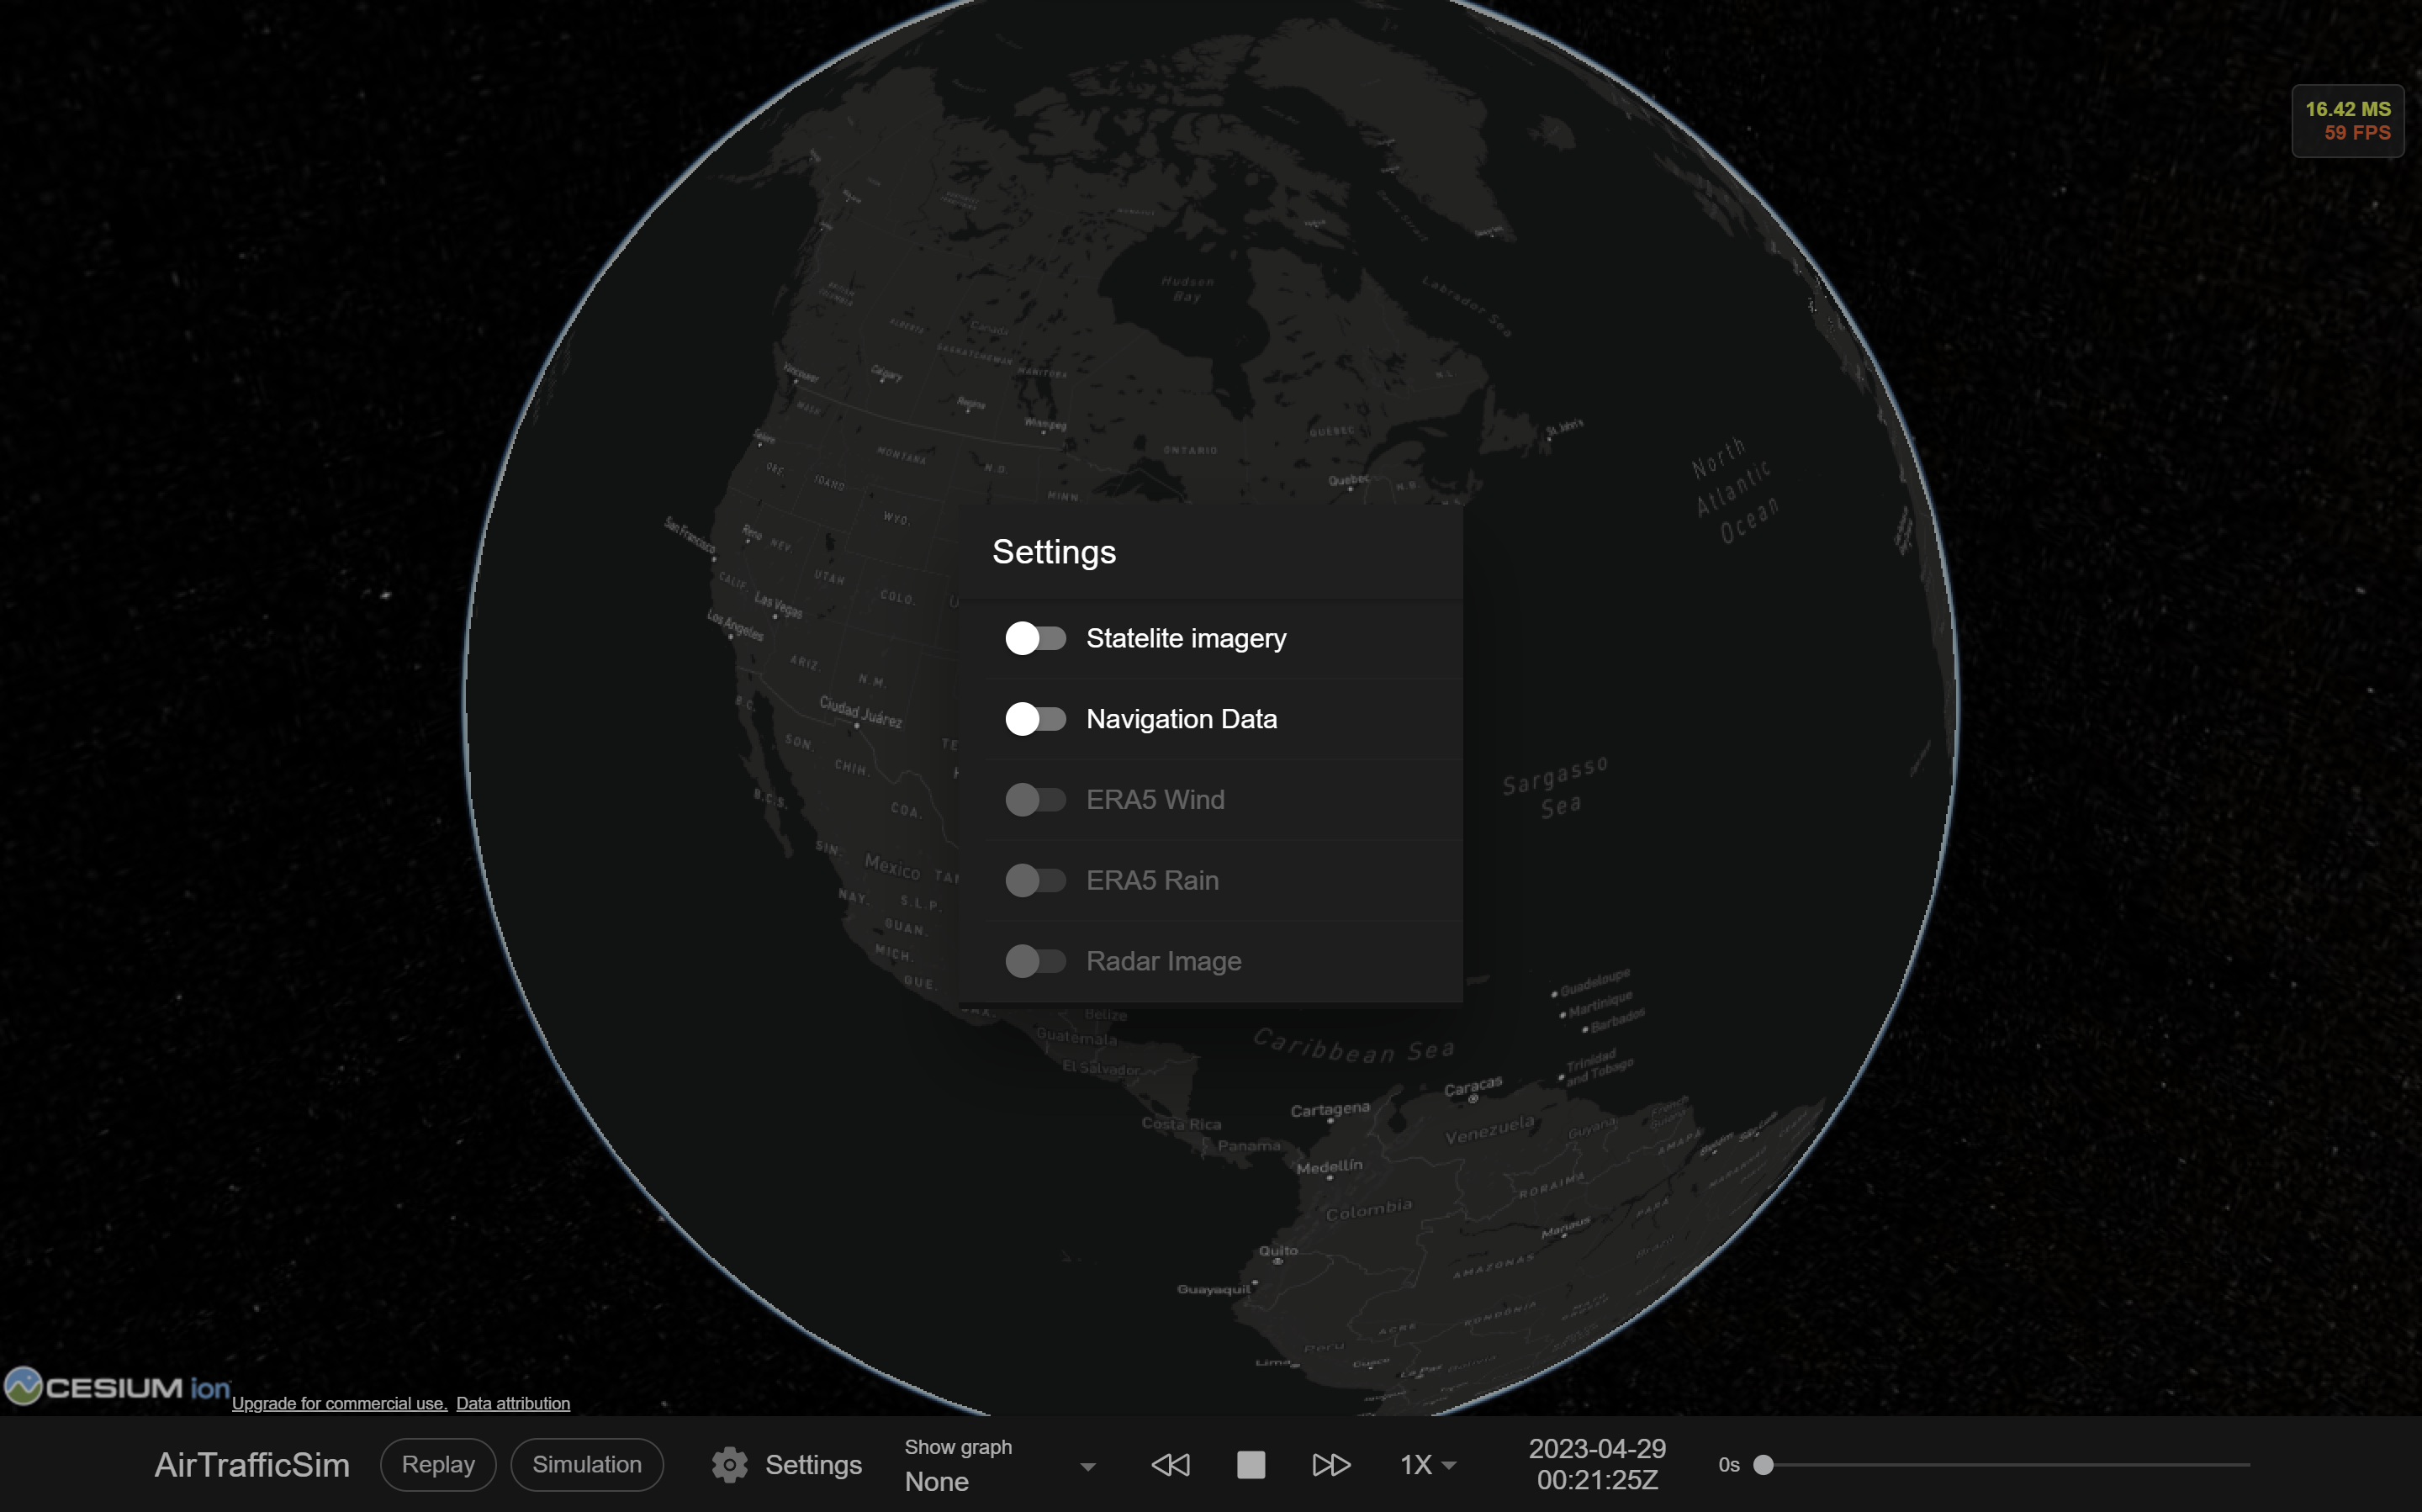
3. Setting#
In the setting, you can select different visualisation layers including satellite imagery, navigation data, ERA5 wind and rain data, and weather radar images. Note that the weather data may be disabled or not loaded depending on the selected replay file and whether the data is downloaded or supplied.
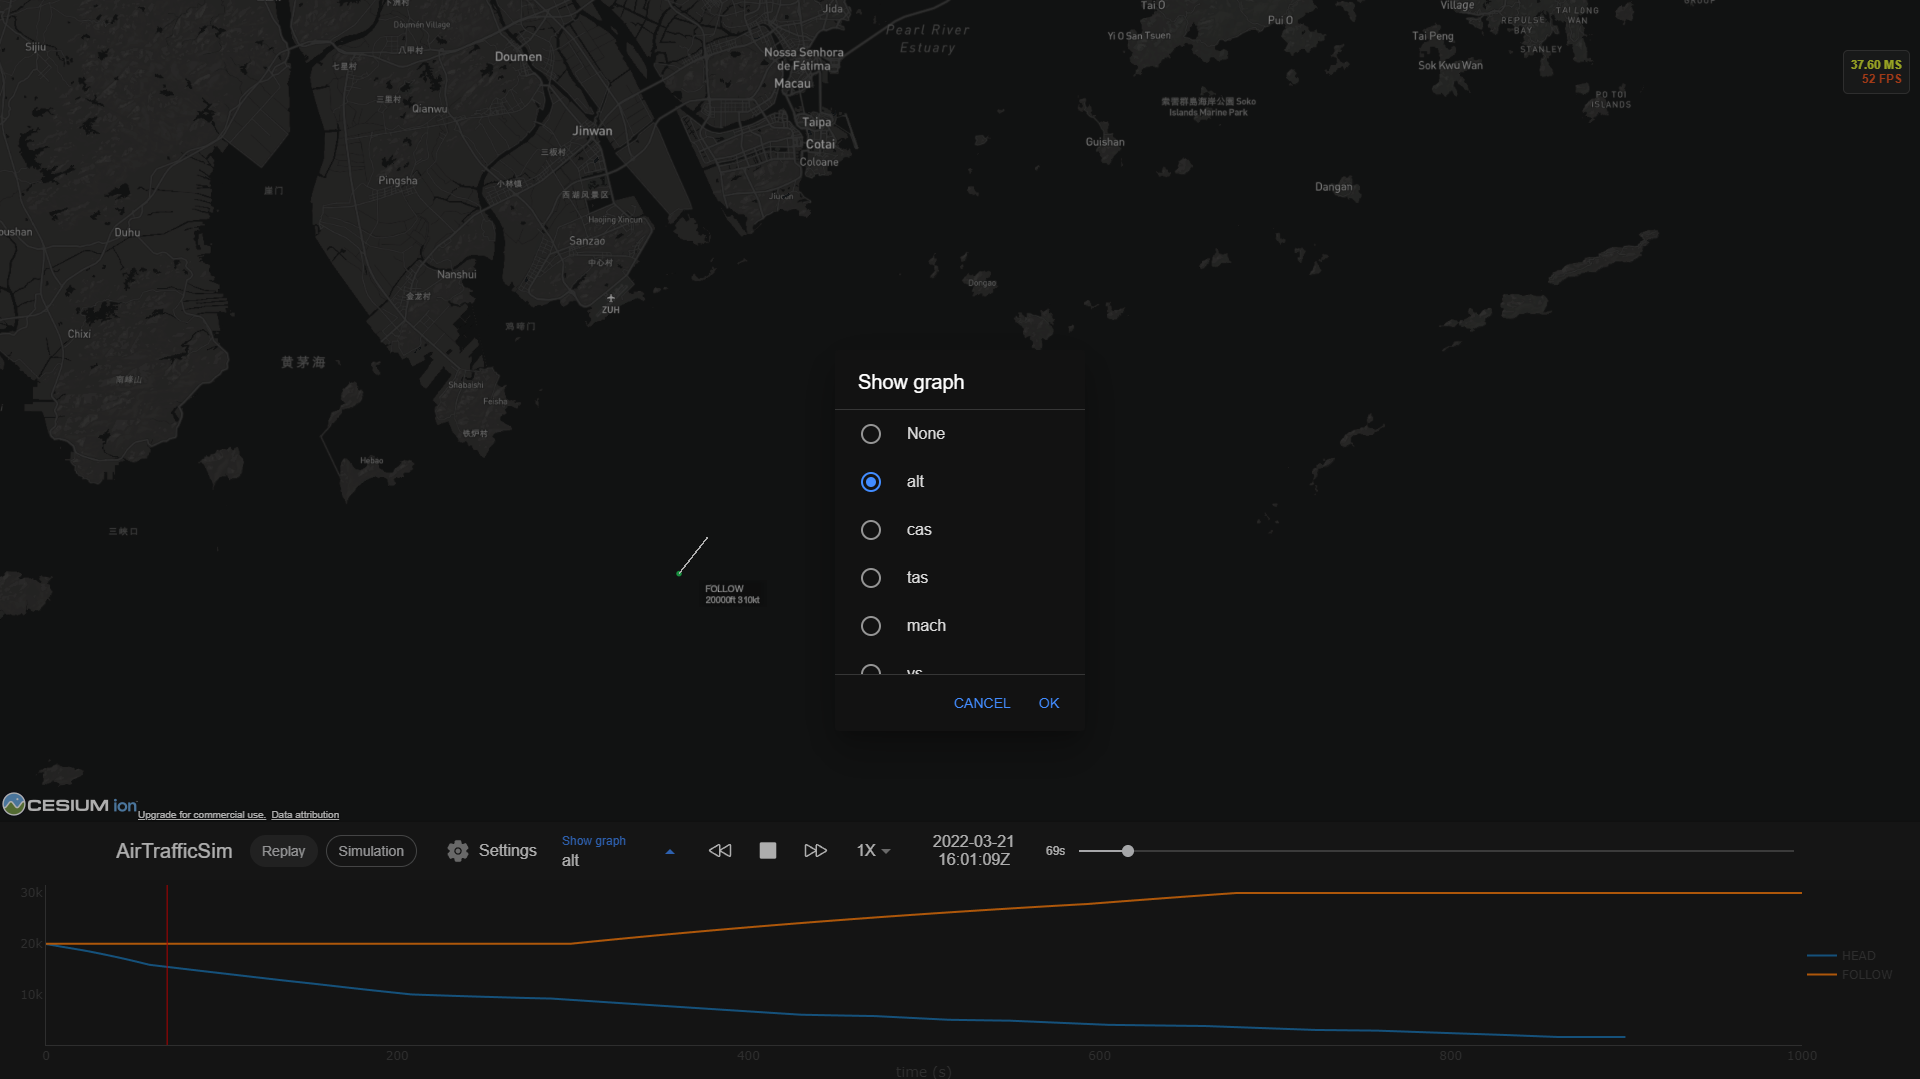
4. Show graph#
When AirTrafficSim is in Simulation mode or Replay mode with simulation data, you can view the graph of different simulation parameters by clicking the Show graph button.
6. Speed selector#
You can select how fast the data are played from 1X, 2X, 5X, 10X, 20X, 50X, to 100X.
7. Clock#
The clock indicates the current time of the environment in UTC format.
8. Timeline#
The timeline represents the full duration of the data file. You can drag the timeline to different positions to quickly go through different moments.